Volodymyr Kyrylyuk // Shutterstock
If you’re planning a move soon, you may want to check out this list.
Stacker compiled a list of cities with the most expensive homes in North Carolina using data from Zillow. Cities are ranked by the Zillow Home Values Index for all homes as of January 2023. The charts in this story were created automatically using Matplotlib. The most expensive city on the list has a typical home value of $9,068,339, which is 346% higher than the state average of $302,275.
Metros with the most cities in the top 30 in North Carolina
#1. Kill Devil Hills, NC: 7
#2. Myrtle Beach-Conway-North Myrtle Beach, SC-NC: 4
#2. Wilmington, NC: 4
#4. Charlotte-Concord-Gastonia, NC-SC: 3
#4. Morehead City, NC: 3
#6. Cullowhee, NC: 2
#7. Asheville, NC: 1
#7. Boone, NC: 1
#7. Brevard, NC: 1
#7. Durham-Chapel Hill, NC: 1
#7. Hickory-Lenoir-Morganton, NC: 1
#7. Virginia Beach-Norfolk-Newport News, VA-NC: 1
Read on to see which cities made the list.
You may also like: Lowest-earning counties in North Carolina

Stacker
#30. Wesley Chapel
– Typical home value: $562,822
– 1-year price change: +8.6%
– 5-year price change: +59.7%
– Metro area: Charlotte-Concord-Gastonia, NC-SC

Stacker
#29. Indian Beach
– Typical home value: $564,049
– 1-year price change: +11.0%
– 5-year price change: +72.5%
– Metro area: Morehead City, NC

Stacker
#28. Rodanthe
– Typical home value: $574,723
– 1-year price change: +9.7%
– 5-year price change: +66.3%
– Metro area: Kill Devil Hills, NC

Stacker
#27. Caswell Beach
– Typical home value: $577,129
– 1-year price change: +12.7%
– 5-year price change: +60.6%
– Metro area: Myrtle Beach-Conway-North Myrtle Beach, SC-NC

Stacker
#26. Salvo
– Typical home value: $587,601
– 1-year price change: +10.1%
– 5-year price change: +62.4%
– Metro area: Kill Devil Hills, NC
You may also like: Most popular baby names for boys of the last decade in North Carolina

Stacker
#25. Kitty Hawk
– Typical home value: $590,755
– 1-year price change: +12.0%
– 5-year price change: +62.8%
– Metro area: Kill Devil Hills, NC

Stacker
#24. Lake Toxaway
– Typical home value: $592,607
– 1-year price change: +16.5%
– 5-year price change: +76.5%
– Metro area: Brevard, NC

Stacker
#23. Pine Knoll Shores
– Typical home value: $606,315
– 1-year price change: +8.3%
– 5-year price change: +73.6%
– Metro area: Morehead City, NC

Stacker
#22. Blowing Rock
– Typical home value: $607,548
– 1-year price change: +9.6%
– 5-year price change: +77.8%
– Metro area: Boone, NC

Stacker
#21. New Hill
– Typical home value: $610,494
– 1-year price change: +9.0%
– 5-year price change: +63.1%
– Metro area: Durham-Chapel Hill, NC
You may also like: 17% of people live near toxic release facilities—here’s how it breaks down in North Carolina

Stacker
#20. Glenville
– Typical home value: $632,330
– 1-year price change: +13.8%
– 5-year price change: +95.7%
– Metro area: Cullowhee, NC

Stacker
#19. Nags Head
– Typical home value: $633,168
– 1-year price change: +12.8%
– 5-year price change: +63.5%
– Metro area: Kill Devil Hills, NC

Stacker
#18. Surf City
– Typical home value: $634,603
– 1-year price change: +13.6%
– 5-year price change: +100.2%
– Metro area: Wilmington, NC

Stacker
#17. Emerald Isle
– Typical home value: $647,897
– 1-year price change: +7.8%
– 5-year price change: +68.0%
– Metro area: Morehead City, NC

Stacker
#16. Saint James
– Typical home value: $657,214
– 1-year price change: +13.0%
– 5-year price change: +60.9%
– Metro area: Myrtle Beach-Conway-North Myrtle Beach, SC-NC
You may also like: See how low property taxes in North Carolina are

Stacker
#15. Kure Beach
– Typical home value: $680,744
– 1-year price change: +10.7%
– 5-year price change: +79.9%
– Metro area: Wilmington, NC

Stacker
#14. Terrell
– Typical home value: $720,753
– 1-year price change: +9.3%
– 5-year price change: +73.3%
– Metro area: Hickory-Lenoir-Morganton, NC

Stacker
#13. Southern Shores
– Typical home value: $731,100
– 1-year price change: +11.3%
– 5-year price change: +66.4%
– Metro area: Kill Devil Hills, NC

Stacker
#12. Holden Beach
– Typical home value: $780,691
– 1-year price change: +12.9%
– 5-year price change: +77.1%
– Metro area: Myrtle Beach-Conway-North Myrtle Beach, SC-NC

Stacker
#11. Waves
– Typical home value: $782,712
– 1-year price change: +11.7%
– 5-year price change: +62.2%
– Metro area: Kill Devil Hills, NC
You may also like: Highest-rated breweries in North Carolina

Stacker
#10. Highlands
– Typical home value: $805,284
– 1-year price change: +10.0%
– 5-year price change: +89.6%
– Metro area: not in a metro area

Stacker
#9. Corolla
– Typical home value: $831,653
– 1-year price change: +9.1%
– 5-year price change: +66.1%
– Metro area: Virginia Beach-Norfolk-Newport News, VA-NC

Stacker
#8. Topsail Beach
– Typical home value: $839,289
– 1-year price change: +15.6%
– 5-year price change: +102.4%
– Metro area: Wilmington, NC

Stacker
#7. Weddington
– Typical home value: $844,920
– 1-year price change: +8.9%
– 5-year price change: +67.5%
– Metro area: Charlotte-Concord-Gastonia, NC-SC

Stacker
#6. Duck
– Typical home value: $884,284
– 1-year price change: +13.5%
– 5-year price change: +77.5%
– Metro area: Kill Devil Hills, NC
You may also like: Highest-rated things to do in North Carolina, according to Tripadvisor

Stacker
#5. Marvin
– Typical home value: $957,125
– 1-year price change: +5.8%
– 5-year price change: +55.4%
– Metro area: Charlotte-Concord-Gastonia, NC-SC

Stacker
#4. Cashiers
– Typical home value: $990,835
– 1-year price change: +16.3%
– 5-year price change: +108.2%
– Metro area: Cullowhee, NC

Stacker
#3. Bald Head Island
– Typical home value: $1,113,642
– 1-year price change: +11.3%
– 5-year price change: +76.9%
– Metro area: Myrtle Beach-Conway-North Myrtle Beach, SC-NC

Stacker
#2. Wrightsville Beach
– Typical home value: $1,317,333
– 1-year price change: +12.3%
– 5-year price change: +82.1%
– Metro area: Wilmington, NC

Stacker
#1. Biltmore Forest
– Typical home value: $1,349,502
– 1-year price change: +7.4%
– 5-year price change: +55.3%
– Metro area: Asheville, NC
You may also like: Zip codes with the most expensive homes in North Carolina
Author
Politics
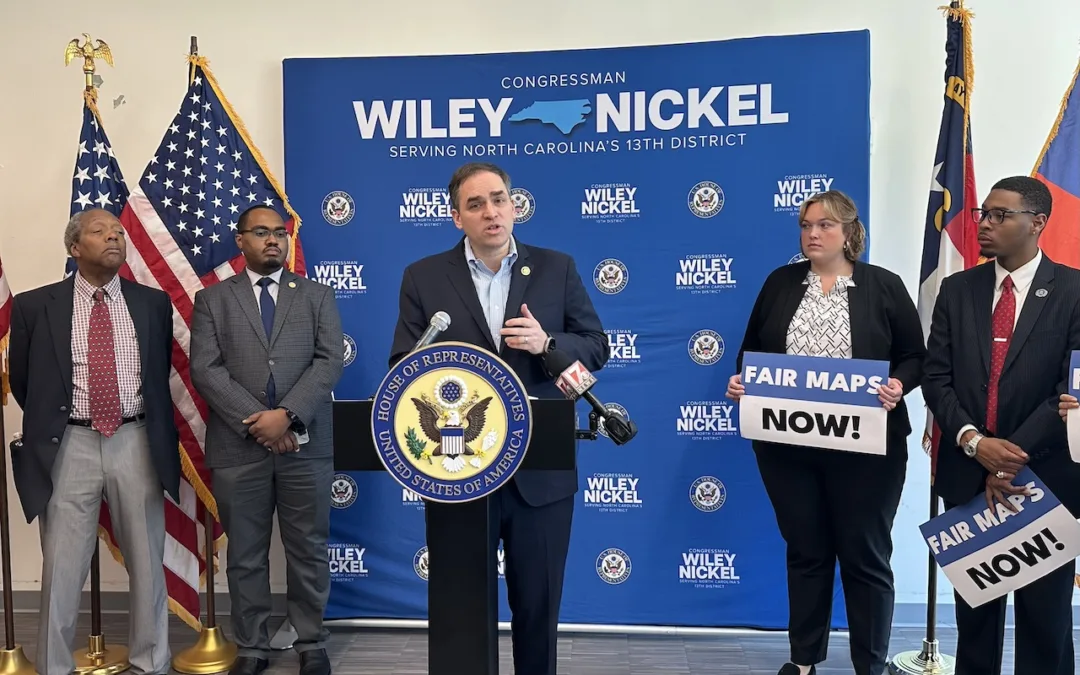
Op-ed: Why we need to ban partisan gerrymandering once and for all
Some legislatures draw election maps that empower their favored voters and disenfranchise those on the other side. The “Fair Maps Act,” Congressman...

VIDEO: This Woman’s Devastating Story Shows the Consequences of Overturning Roe v. Wade
View this post on Instagram A post shared by Cardinal & Pine (@cardinalandpine) Amanda Zurawski and her husband Josh had tried for...
Local News

The 5 most believable UFO sightings ever reported in North Carolina
Read about five alien encounters that may forever remain unexplained. When you think of the most common places where you might hear a UFO sighting...

Good News Friday: It’s a good day to be a fan of the NC State Wolfpack
The men's and women's teams will compete for a national championship in college basketball this weekend. Plus: How to watch the solar eclipse, and...